Component Auto Scaling
The load of components constantly changes, sometimes high and sometimes low, making it difficult to configure appropriate resources; Rainbond introduces auto scaling to solve this problem well. Component auto scaling continuously observes the metrics set by the user. Once the metric exceeds or falls below the desired threshold, it automatically scales the component.
This article will introduce the auto scaling feature of components from the following three aspects:
- The principle of component auto scaling.
- How to use component auto scaling.
- A demonstration example of component auto scaling.
The principle of component auto scaling
There are two types of component auto scaling, horizontal auto scaling and vertical auto scaling. Horizontal scaling increases or decreases the number of component replicas; while automatic horizontal scaling automatically performs horizontal scaling of components based on the component's CPU usage, memory, or other custom metrics.
Vertical scaling allocates more or less CPU and memory to the component; while automatic vertical scaling automatically performs vertical scaling of components based on the component's CPU usage, memory, or other custom metrics.
Currently (5.1.9), Rainbond only supports horizontal auto scaling of components, so this article will not cover much about vertical auto scaling.
Horizontal auto scaling of components
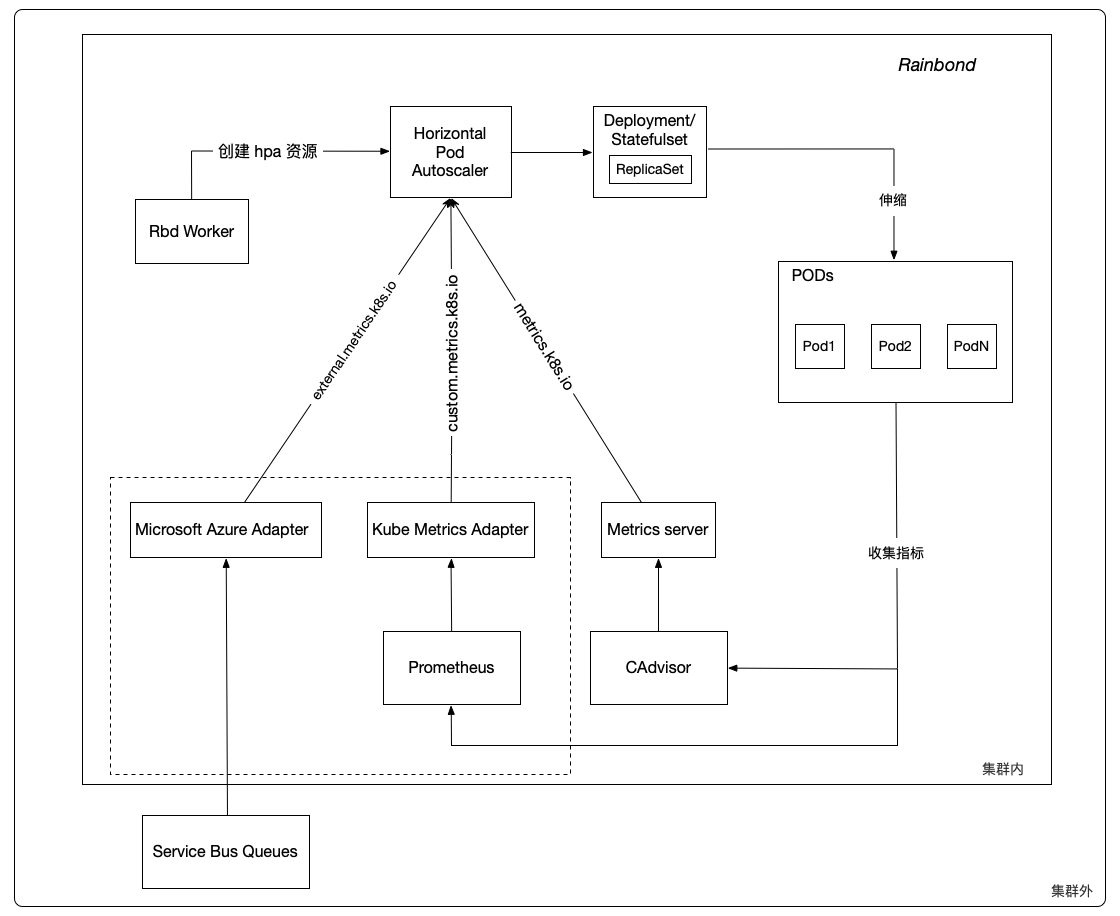
Horizontal Pod Autoscaler consists of two parts, HPA resource and HPA controller. HPA resource defines the behavior of the component, including metrics, desired values, and maximum and minimum replica counts. HPA controller periodically checks the metrics set for the component; its cycle is controlled by the controller manager parameter --horizontal-pod-autoscaler-sync-period, defaulting to 15 seconds.
Rbd Worker is responsible for converting the metrics, desired values, and maximum and minimum replica counts you set for the component in the Rainbond console into HPA resources in the Kubernetes cluster. For use by the HPA controller.
In each cycle, the HPA controller queries the metrics set by the user for each component through the metrics API; when the metrics exceed or fall below the desired threshold, the HPA controller adjusts the replica count in Deployment/Statefulset, and finally, Deployment/Statefulset completes the increase or decrease of component instances.
The HPA controller generally observes metrics from three aggregated APIs: metrics.k8s.io, custom.metrics.k8s.io, and external.metrics.k8s.io.
The metrics.k8s.io API is provided by metrics-server, corresponding to resource metrics, namely CPU usage rate, CPU usage, and memory usage rate, memory usage. This is also the type of metrics currently supported by Rainbond.
custom.metrics.k8s.io corresponds to custom metrics, external.metrics.k8s.io corresponds to external metrics. For example: requests-per-second, packets-per-second.
Provided by Kube Metrics Adapter, Prometheus Adapter
Or provided by third-party services that implement the Kubernetes metrics API definition. Custom metrics and external metrics are largely the same.
Custom metrics do not support usage rates, only values, or usage, which is the average value of each instance of the component.
Currently, in version 5.1.9, Rainbond only supports resource metrics, i.e., metrics related to CPU and memory. The custom metrics and external metrics in the dashed box will be implemented in future versions.
Algorithm for horizontal auto scaling
From the most basic perspective, the Horizontal Pod Autoscaler calculates the desired number of instances based on the ratio of the metric target value and the metric actual value:
desiredReplicas = ceil[currentReplicas * ( currentMetricValue / desiredMetricValue )]
For example, if the actual metric value is 200m, the desired value is 100m, then the number of instances will double, because 200.0 / 100.0 == 2.0; if the actual value drops to 50m, then
the number of instances remains unchanged, because 50.0 / 100.0 == 0.5 (the ratio is close to 1.0, the HPA controller will skip scaling).
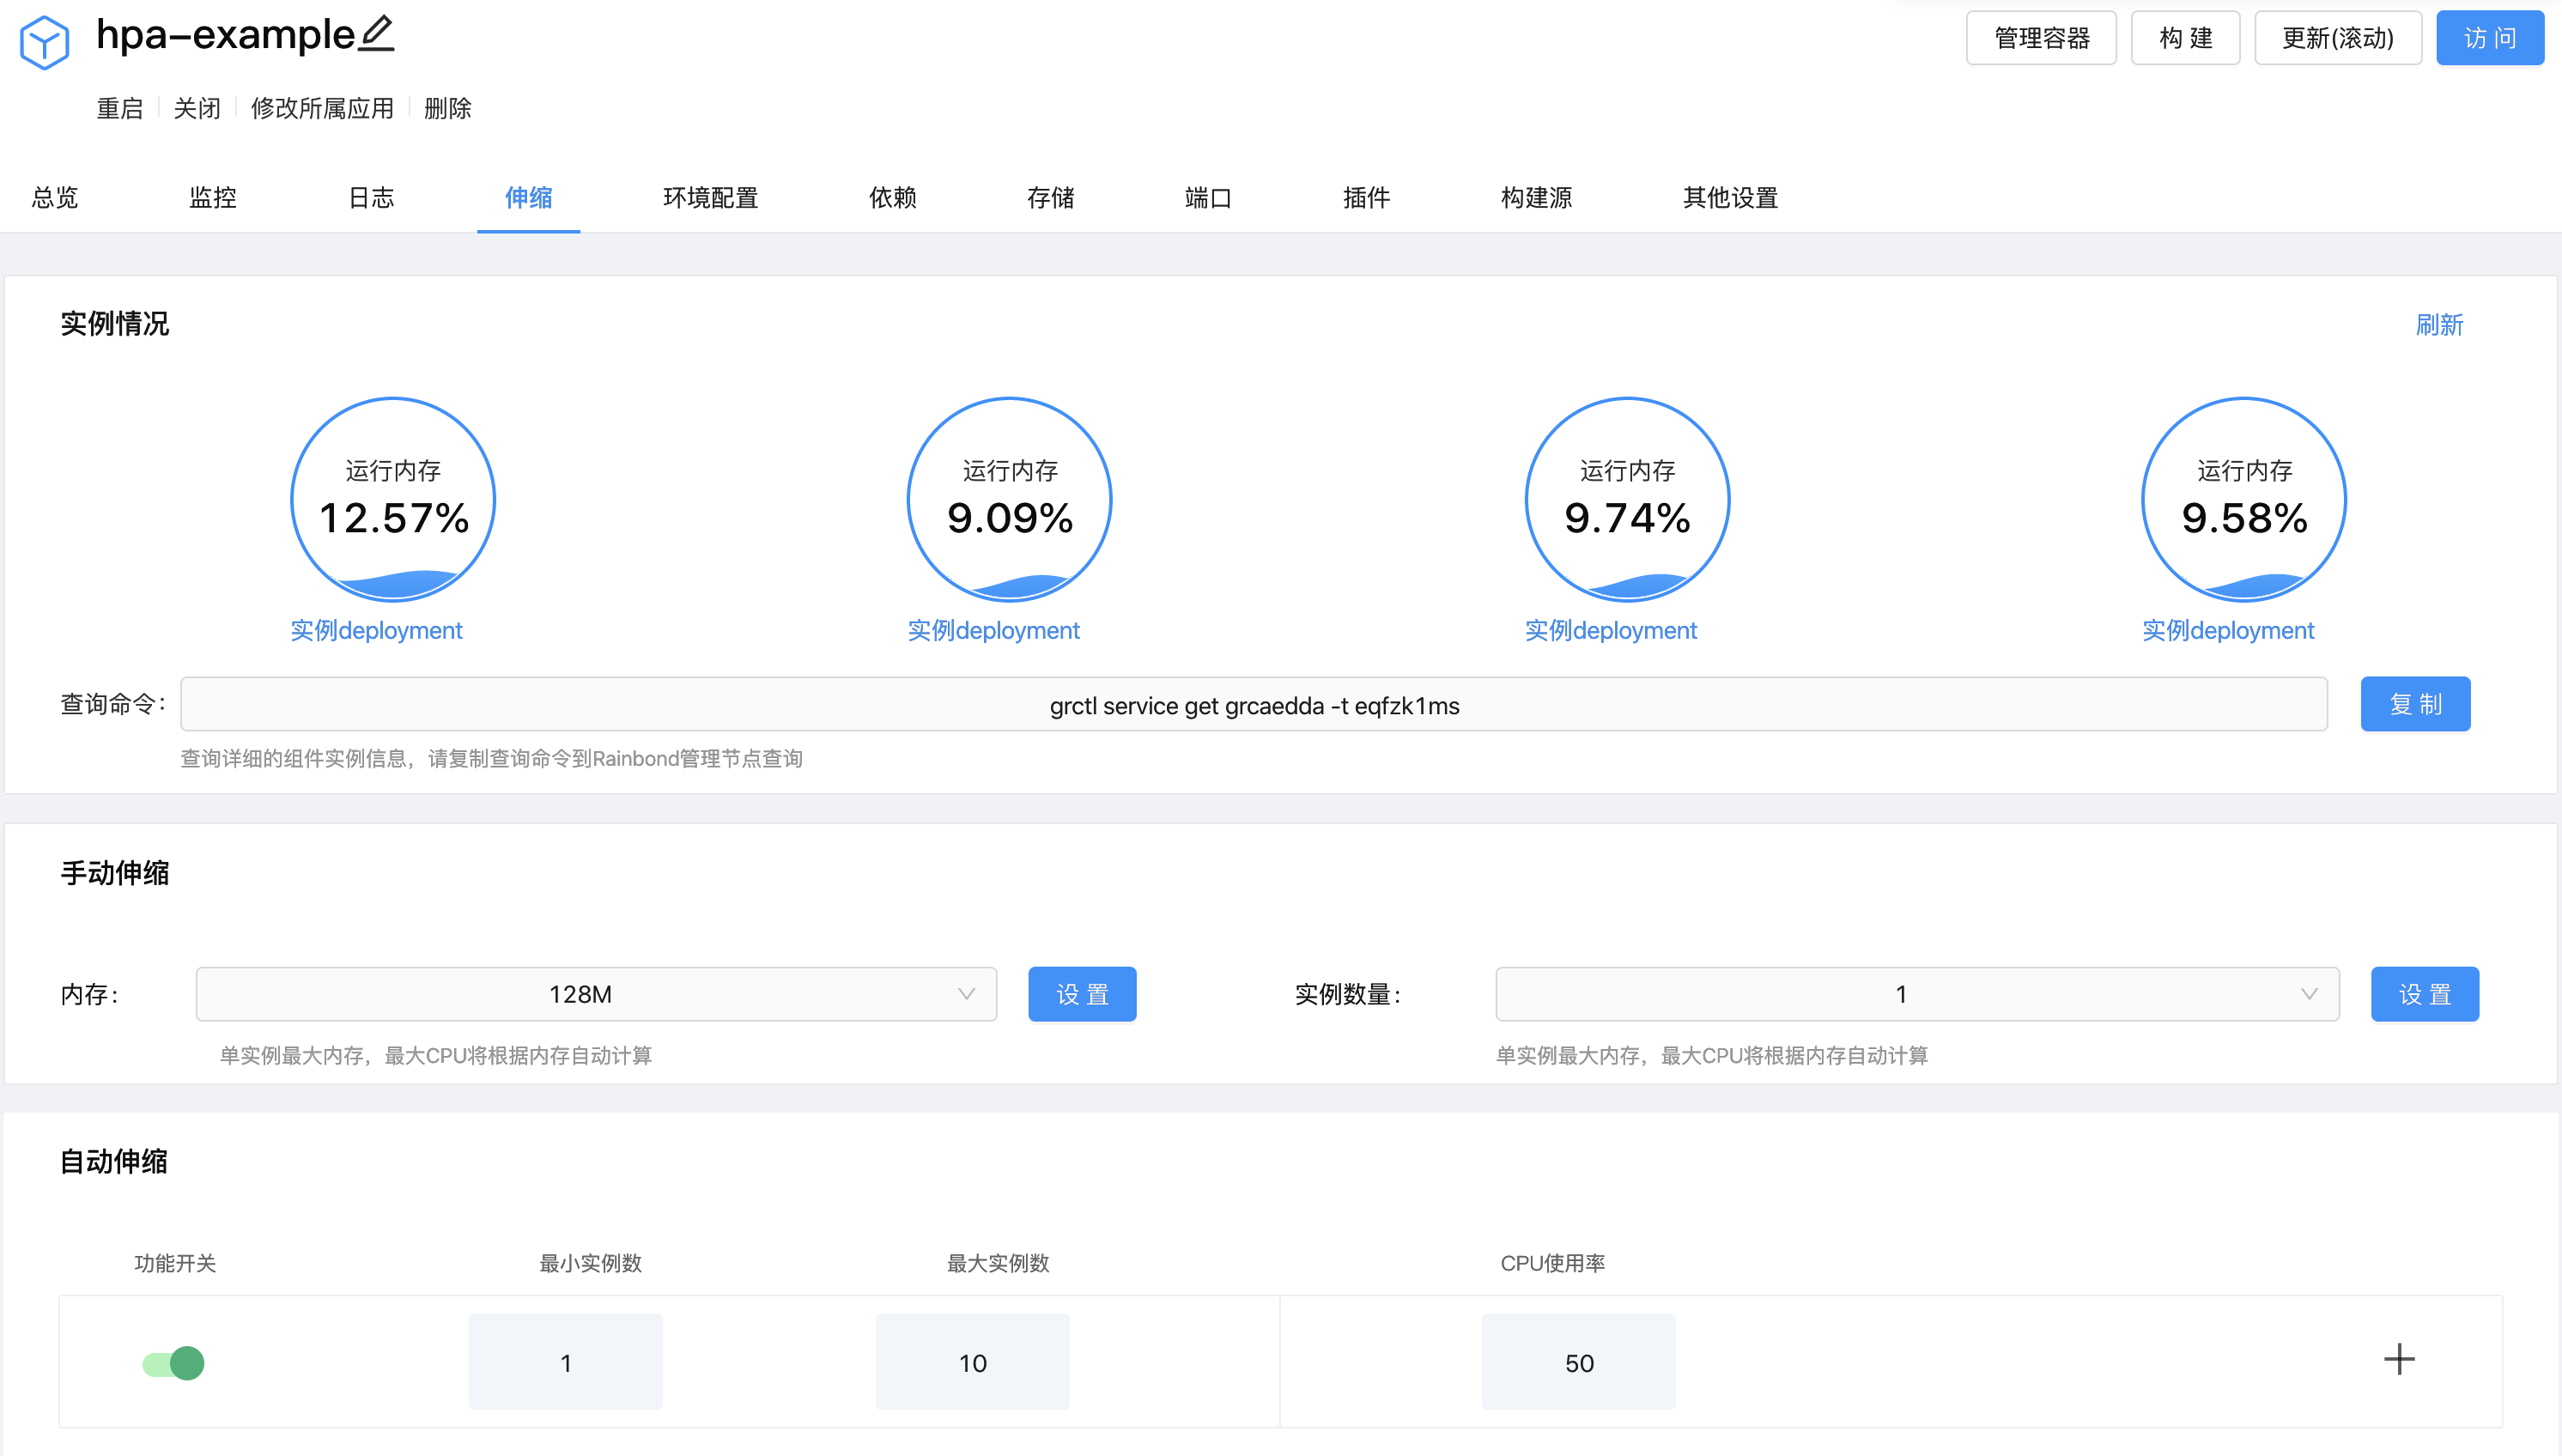
Using component auto scaling
The auto scaling of components is located in the Scaling option on the component page, below Manual Scaling.
As mentioned in [Horizontal auto scaling of components](#Horizontal auto scaling of components), you can set the maximum number of replicas, minimum number of replicas, and metrics for auto scaling on the auto scaling page.
Maximum number of instances
When the actual value of the metric exceeds its desired value, the number of component instances will continuously increase, trying to make the actual value of the metric lower than the desired value. When the number of instances equals the maximum number of instances, and the actual value of the metric
is still higher than the desired value, then the number of instances is fixed at the maximum number of instances, and will not continue to grow.
Minimum number of instances
When the actual value of the metric is lower than its desired value, the number of component instances will continuously decrease, trying to make the actual value of the metric close to the desired value. When the number of instances equals the minimum number of instances, and the actual value of the metric
has not approached the desired value, then the number of instances is fixed at the minimum number of instances, and will not continue to decrease.
Metrics
Currently, Rainbond only supports resource metrics, namely CPU usage rate, CPU usage, memory usage rate, and memory usage.
The unit of CPU usage is m, 1m equals one-thousandth of a core. The unit of memory usage is Mi.
Metrics support adding and deleting, following the rules below:
- There can only be one metric about CPU, that is, the two metrics
CPU usage rateandCPU usagecannot coexist. The same goes for memory. - There must be at least one metric, that is, all metrics cannot be deleted.
- The metric value must be an integer greater than 0.
The modification of the above three types of parameters does not require updating or restarting the component, and the modification takes effect immediately upon success.
A demonstration example
Create component hpa-example
To demonstrate the horizontal auto scaling of components, we will use a custom docker image based on the php-apache image. The content of the Dockerfile is as follows:
FROM php:5-apache
ADD index.php /var/www/html/index.php
RUN chmod a+rx index.php
It defines an index.php page that performs some very CPU-intensive calculations:
<?php
  $x = 0.0001;
  for ($i = 0; $i <= 1000000; $i++) {
    $x += sqrt($x);
  }
  echo "OK!";
?>
You can build the image according to the above Dockerfile, or use our prepared image abewang/hpa-example:latest. We use this image to create a component with a memory limit of 128M and a port of 80.
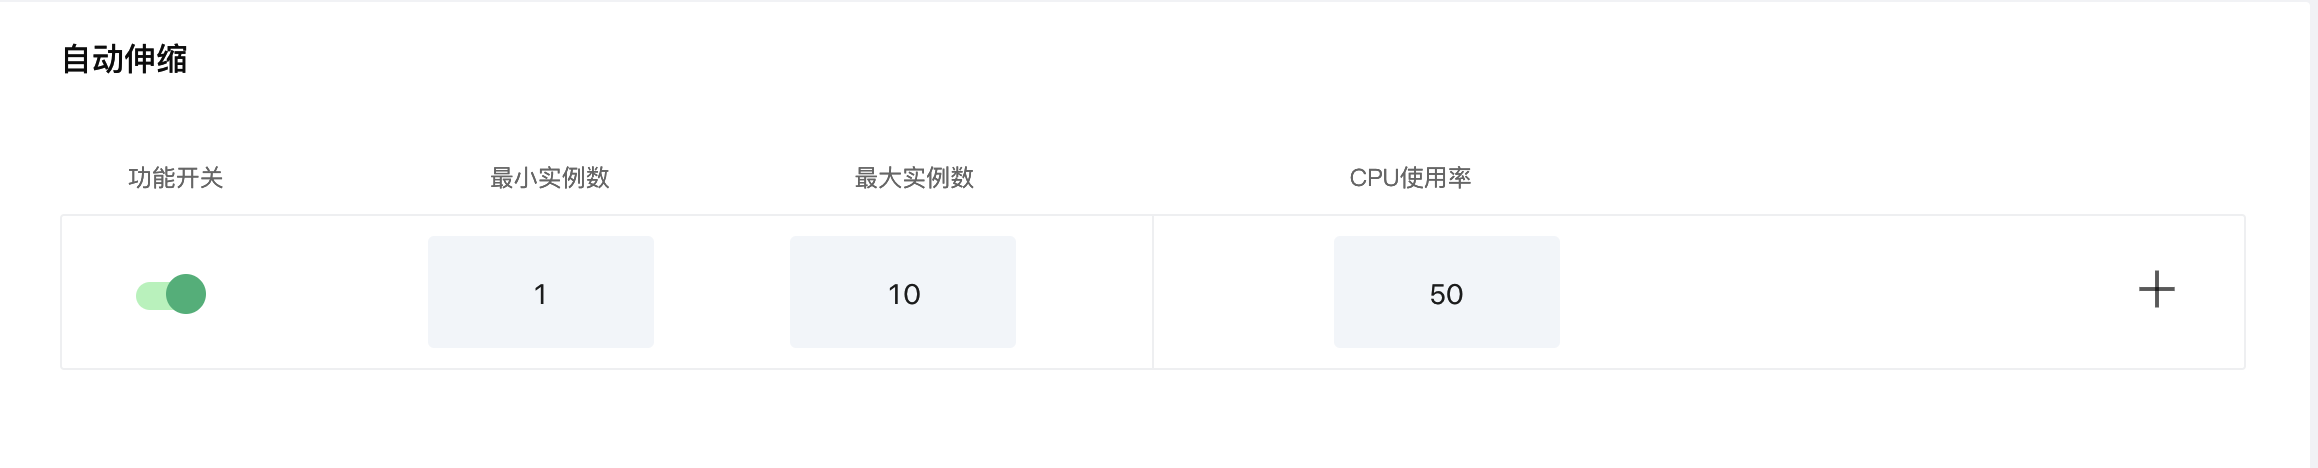
Configure auto scaling
We set the maximum number of instances to 10, the minimum number of instances to 1, and the CPU usage rate to 50%. Roughly speaking, HPA will (through deployment) increase or decrease the number of replicas to maintain the average CPU usage of all Pods at 50%. As shown below:
We use the command line to check the current status of hpa:
root@r6dxenial64:~# kubectl get hpa --all-namespaces\nNAMESPACE NAME REFERENCE TARGETS MINPODS MAXPODS REPLICAS AGE\n6b981574b23d4073a226cf95faf497e3 a737ffa9edca436fadb609d5b3dab1bd Deployment/5a8e8667d96e194be248f2856dcaedda-deployment 1%/40% 1 10 1 1h
Increase load
Now, we open a Linux terminal and send messages to the php-apache service in an infinite loop.
# Please replace http://80.grcaedda.eqfzk1ms.75b8a5.grapps.cn with your actual domain name\nwhile true; do wget -q -O- http://80.grcaedda.eqfzk1ms.75b8a5.grapps.cn; done
After one minute, we use the following command to check the status of hpa:
root@r6dxenial64:~# kubectl get hpa --all-namespaces\nNAMESPACE NAME REFERENCE TARGETS MINPODS MAXPODS REPLICAS AGE\n6b981574b23d4073a226cf95faf497e3 a737ffa9edca436fadb609d5b3dab1bd Deployment/5a8e8667d96e194be248f2856dcaedda-deployment 270%/40% 1 10 1 1h
It can be seen that the CPU usage has risen to 270%. This caused the number of instances to be increased to 4. As shown below:
Reduce load
Now, we stop the infinite loop running in the Linux terminal to reduce the load on the component. Then, we check the status of hpa as follows:
root@r6dxenial64:~# kubectl get hpa --all-namespaces\nNAMESPACE NAME REFERENCE TARGETS MINPODS MAXPODS REPLICAS AGE\n6b981574b23d4073a226cf95faf497e3 a737ffa9edca436fadb609d5b3dab1bd Deployment/5a8e8667d96e194be248f2856dcaedda-deployment 3%/50% 1 10 1 1h
CPU usage dropped to 0, so the number of instances scaled to 1.
Horizontal scaling record
Let's observe the horizontal scaling record of the component to see what happened in this process. As shown below:
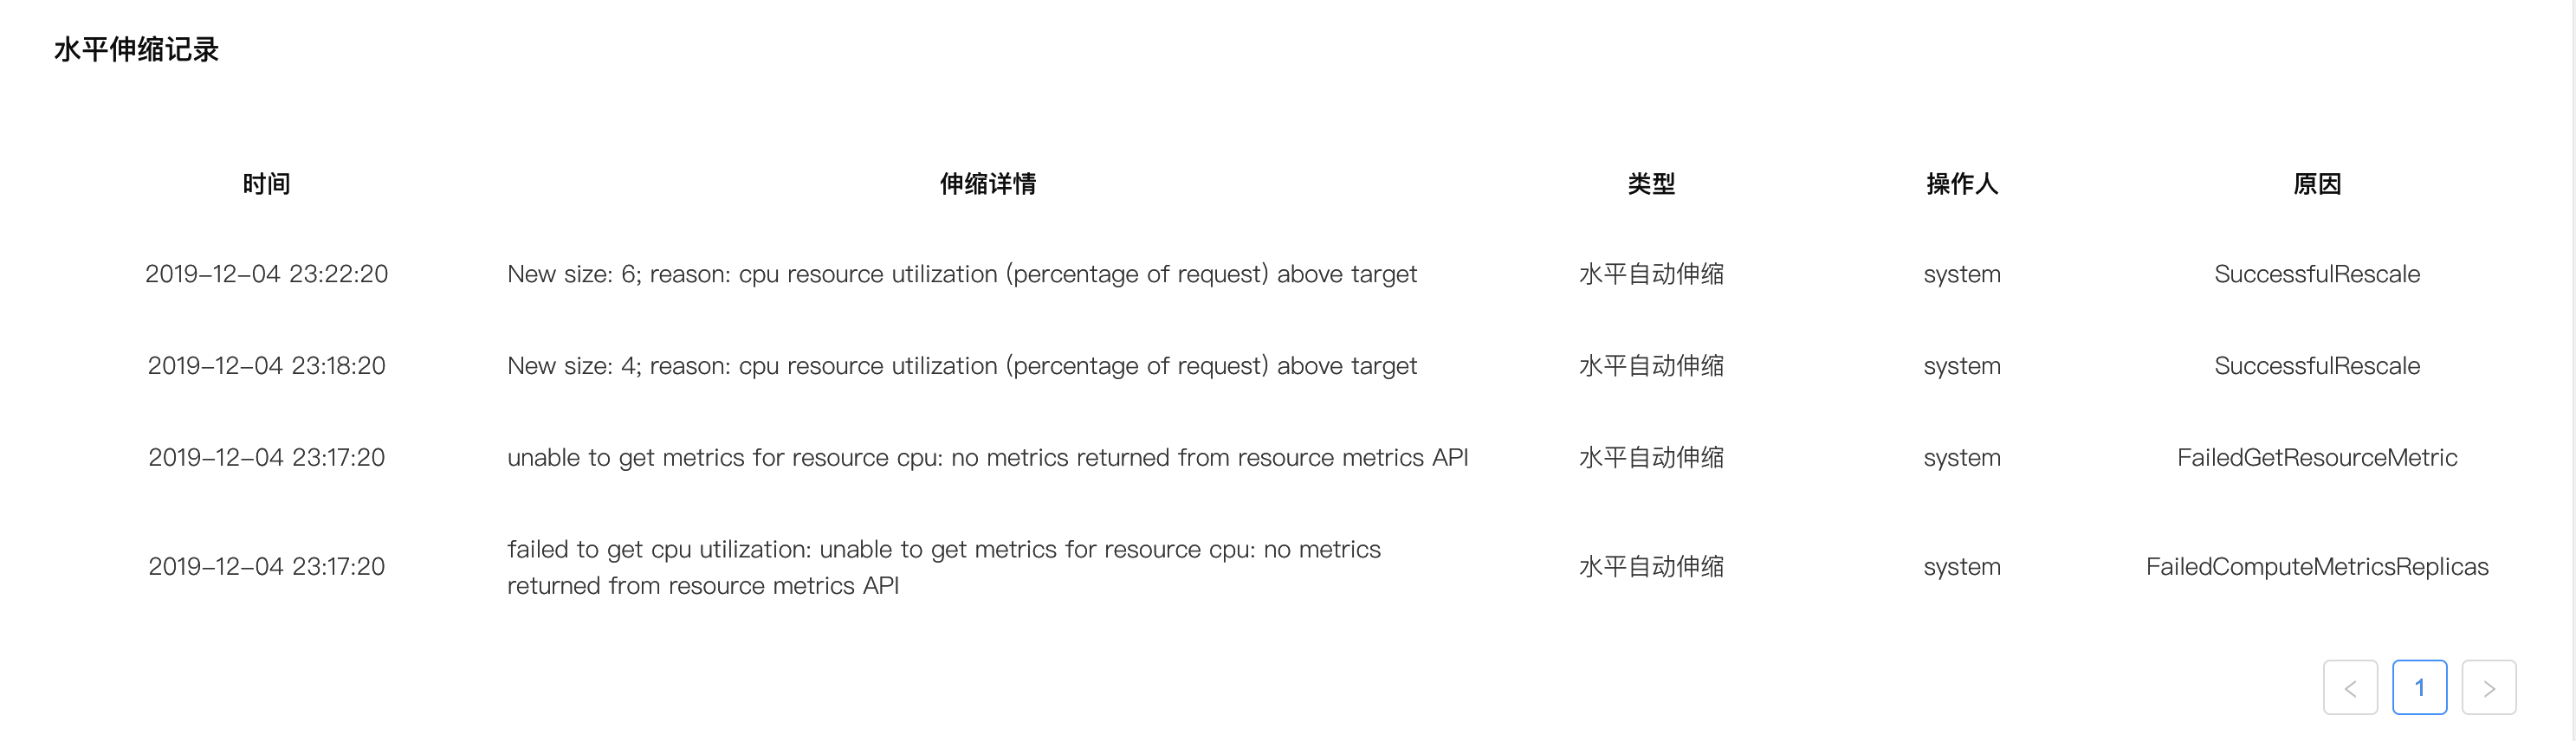
After we configured the relevant parameters, horizontal auto-scaling took effect, but at this time the metrics were not ready yet, so we saw two records of failed metric acquisition. After we continuously sent messages to the component in an infinite loop, horizontal auto-scaling detected that the CPU usage exceeded the target value and started to scale the number of instances to 4, then to 6. When we stopped sending messages, the load went down, and horizontal auto-scaling detected that the CPU usage was below the target value, directly scaling the number of instances to 1.
Rainbond records the instance change process of the component, allowing operation and maintenance personnel to view the instance changes of the component at any time.